CAISO Market Monitoring
Track California's grid in real time — demand, solar generation, LMP prices, and storage opportunities.
Check System Demand
Start every morning briefing with the big number: how much power is California consuming right now? CAISO publishes system-wide demand in five-minute intervals across every pricing zone. A single tool call gives you the full picture.
Results
Monitor Solar Generation
Solar is the dominant force shaping California's intra-day price curve. By mid-morning, utility-scale PV floods the grid with cheap electrons, suppressing wholesale prices. Knowing the real-time solar output lets you anticipate where prices are heading next.
Results
Solar Generation Curve (MW)
Analyze LMP Prices (The Duck Curve)
Locational Marginal Prices (LMPs) reveal the true cost of electricity at each node. Day-ahead prices at SP15 (Southern California) tell a dramatic story: the famous duck curve, where midday solar pushes prices negative before they surge in the evening ramp.
Day-Ahead LMP — SP15 ($/MWh)
Key Price Points
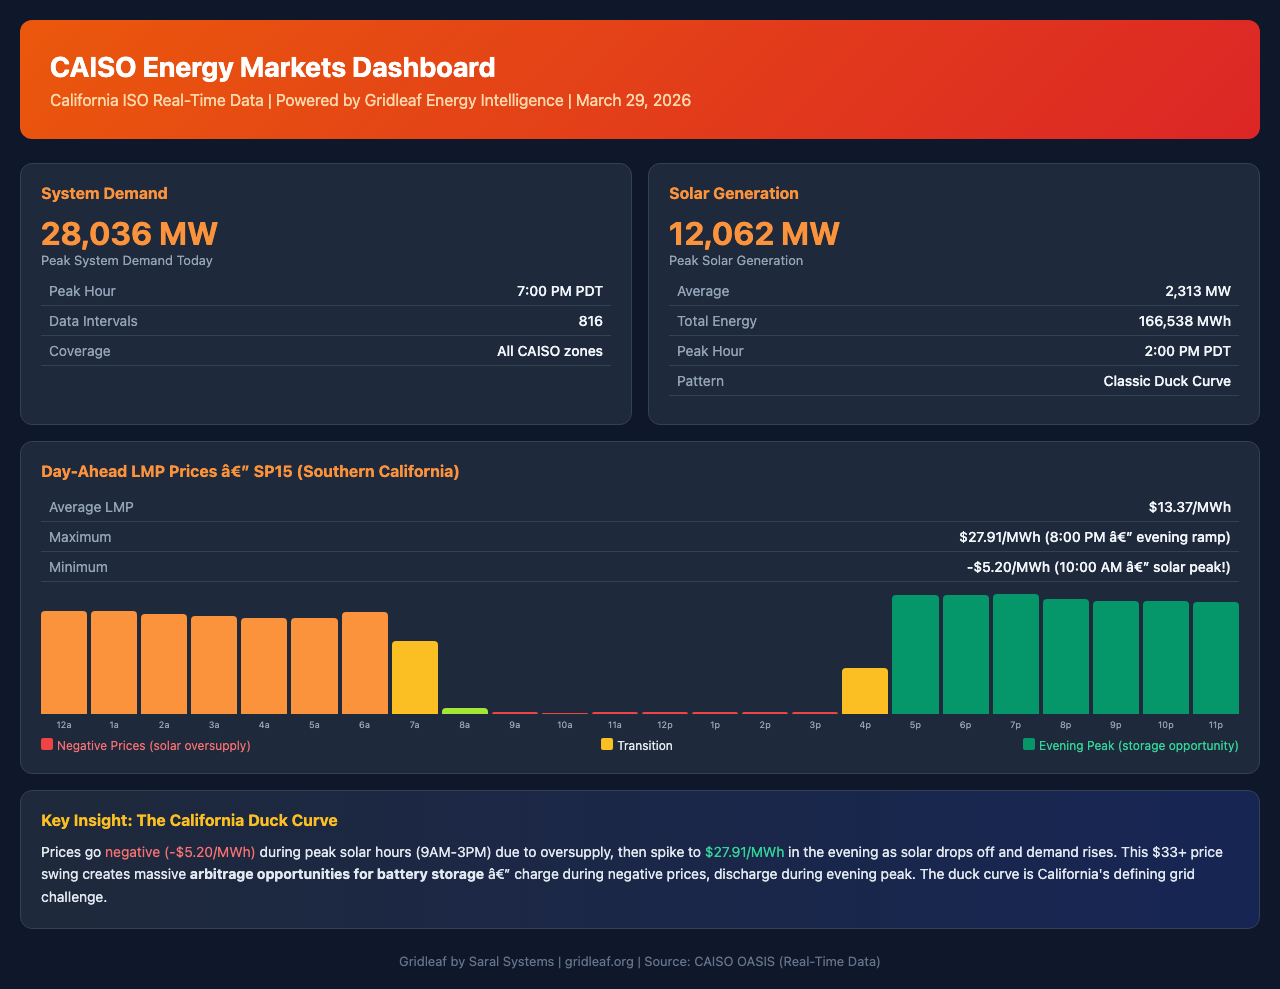
Identify Storage Arbitrage Opportunities
The duck curve isn't just a curiosity — it's a daily, repeatable arbitrage signal. Battery storage operators charge during negative-price hours (when generators pay you to absorb power) and discharge during the evening peak when prices climb back above $27/MWh. Here's the math.
Arbitrage Economics — 100 MW / 4-hour Battery
Charge Price
-$5.20/MWh
Paid to charge
Discharge Price
$27.91/MWh
Evening peak
Understand the Regulatory Landscape
Markets don't exist in a vacuum. Regulatory proceedings determine interconnection rules, storage incentives, and market design. Gridleaf can surface key dockets from the NY PSC so you're never caught off guard by a ruling that reshapes the market.
Key Proceedings
The California Duck Curve — Your Trading Edge
With four Gridleaf tools, you can build a complete morning market briefing in under five minutes: check system demand to gauge overall load, monitor solar generation to anticipate oversupply, pull LMP prices to quantify the duck curve spread, and scan regulatory dockets for structural changes.
Run these same queries throughout the day for intraday monitoring, or track the data over weeks to identify seasonal patterns and refine your long-term trading strategy. The duck curve is predictable, structural, and not going away — if anything, it deepens every year as California adds more solar capacity.