Grid Carbon Analysis
Analyze emissions across the US grid, compare states, and quantify your project's impact
Check Your Grid's Carbon Intensity
Every Scope 2 emissions calculation starts with a single number: how much CO2 your local grid emits per megawatt-hour. Gridleaf pulls this directly from EPA eGRID data, so you never have to dig through spreadsheets again.
Results
Compare States for Maximum Impact
If you're siting a clean energy project or advising on carbon offset purchases, location is everything. Gridleaf can rank all 50 states by carbon intensity in a single call, letting you immediately see where solar, wind, or storage investments avoid the most CO2.
Carbon Intensity Ranking (selected states)
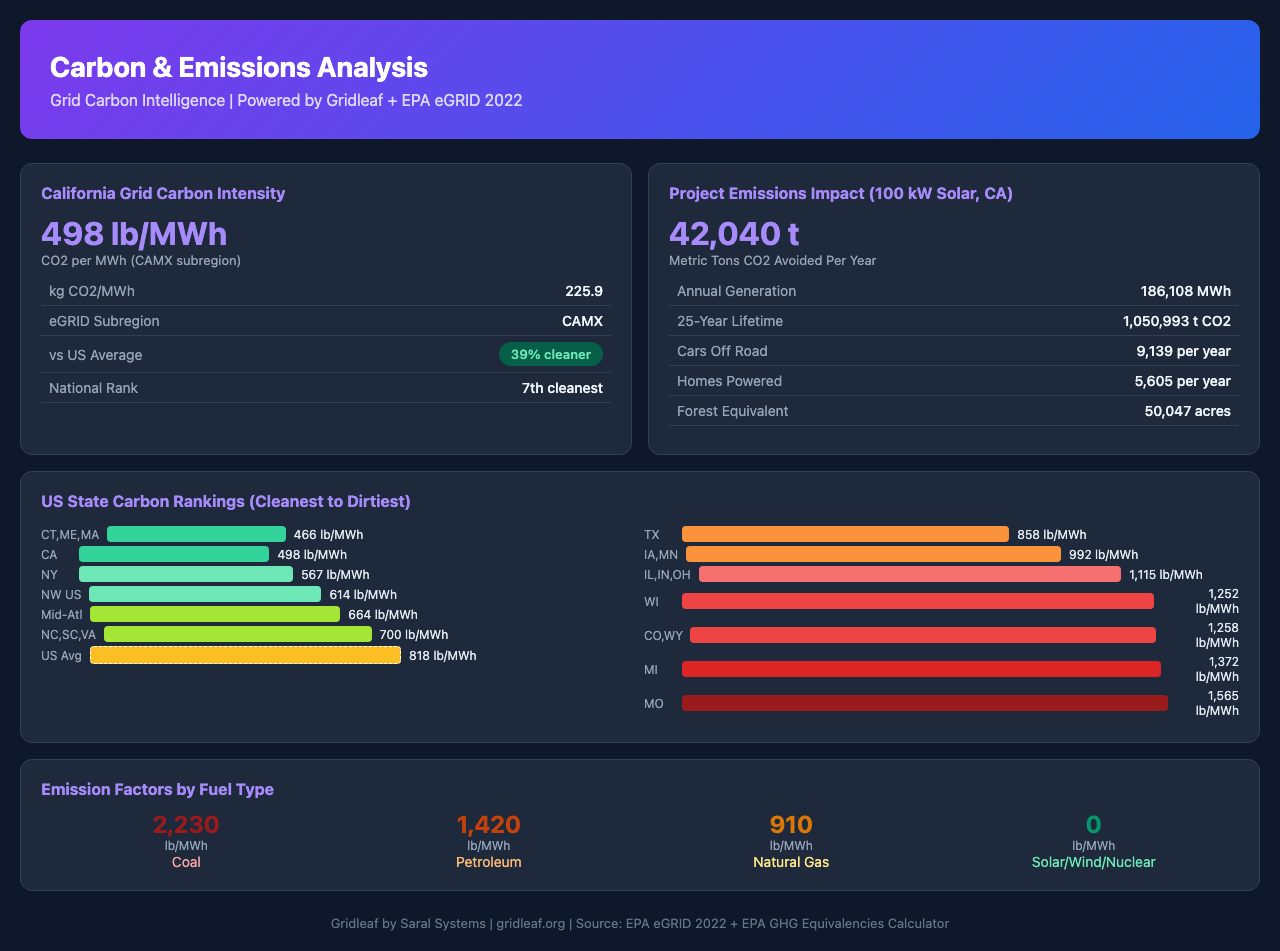
Understand Emission Factors by Fuel Type
State-level averages blend many fuel sources together. To build a compelling narrative in your ESG report, you need to know the emission factor for each fuel type individually. This is what drives the coal-to-gas transition story, and it's what makes renewable energy impactful.
Emission Factors by Fuel Type
Calculate Your Project's Impact
Now bring it all together. Give Gridleaf a project's annual generation and location, and it calculates lifetime CO2 avoidance with real-world equivalencies you can drop directly into ESG reports, investor decks, and carbon credit applications.
Project Impact Summary
Real-World Equivalencies