Solar Site Prospecting
A complete walkthrough for evaluating any US solar site using Claude + Gridleaf. We will assess a real parcel in Lancaster, California — the heart of utility-scale solar country.
Quick Site Screening
Before investing hours into a site, you need a fast pass/fail signal. The site screening tool combines flood risk and solar resource data into a single viability verdict in under five seconds. Think of it as the first filter in your pipeline — most sites that fail here are not worth pursuing.
"Screen a potential solar site at 34.6868, -118.1542 for basic feasibility"
This 5-second check saves hours of manual research. A single API call replaces pulling up FEMA flood maps and NREL solar data separately. If a site fails here, move on immediately.
Solar Resource Assessment
Once a site passes the initial screen, you need granular solar production data for financial modeling. This tool pulls NREL PVWatts data — the industry standard — and returns annual production estimates, monthly breakdowns, and radiation metrics that feed directly into your pro forma.
"What's the solar resource at 34.6868, -118.1542?"
A 21.2% capacity factor is well above the national average of ~15-17% for fixed-tilt systems. Lancaster sits in the Mojave Desert fringe, one of the strongest solar resource zones in the US. The seasonal delta (Sep vs Dec) also matters for revenue projections with time-of-use pricing.
Environmental Due Diligence
Environmental constraints are the most common project killers. A single wetland delineation or endangered species finding can add 12-18 months to your timeline and six figures to your budget. Running these screens early prevents sunk costs on sites with fatal flaws.
"Run environmental screening for the Lancaster site at 34.6868, -118.1542"
A clean environmental screen is exactly what you want to see. No wetlands means no Section 404 permits, no critical habitat means no Section 7 consultation, and no protected areas means no land-use conflicts. This site has no environmental showstoppers.
Terrain Analysis
Slope directly impacts construction costs. Anything above 5% requires specialized racking; above 10% is generally infeasible for utility-scale solar. The terrain tool uses USGS 3DEP elevation data to quantify slopes across the site, so you can estimate grading costs before setting foot on the property.
"Analyze terrain and slopes at 34.6868, -118.1542"
Flat terrain means minimal grading costs — one of the biggest variable line items in solar EPC budgets. With 100% of the site under 5% slope, standard fixed-tilt or single-axis tracker racking systems will work without modification.
Buildable Area Calculation
Here is where point-level checks meet spatial reality. The buildable area tool analyzes the entire parcel against flood zones, wetlands, slopes, streams, and protected land polygons, then returns exactly how many acres you can actually build on. This is the same analysis firms pay Anderson Optimization thousands of dollars to produce.
"Calculate buildable area for a 100-acre parcel at 34.6868, -118.1542"
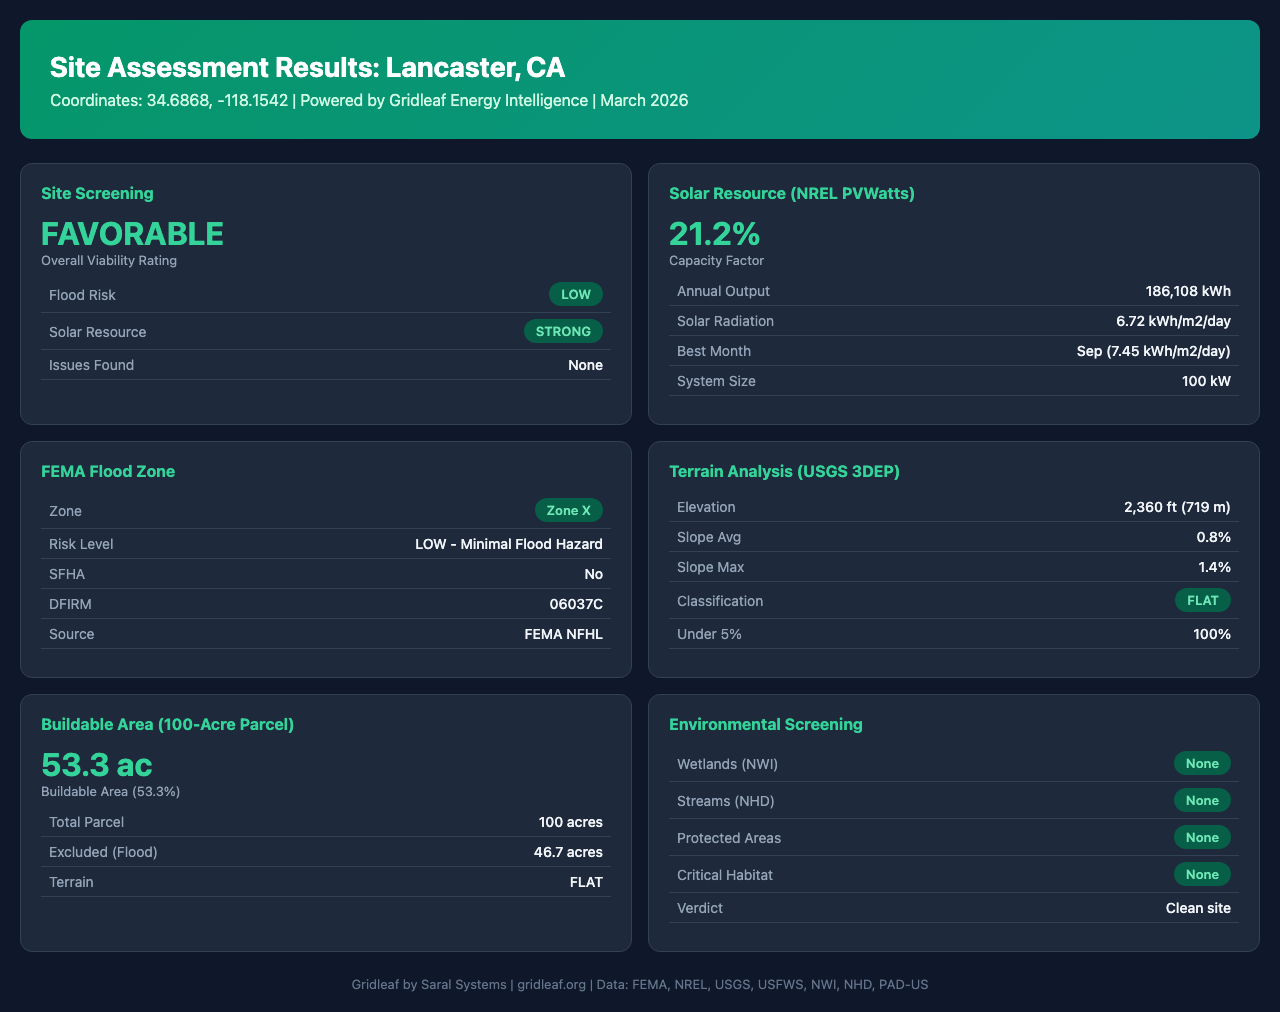
The point-level flood check in Step 3 said LOW risk, but the area-level analysis here reveals that flood zone polygons cover nearly half the parcel. This is exactly why you must run both checks — a point can be outside a flood zone while the broader parcel is not. Always validate with spatial analysis.
Carbon Impact Assessment
Carbon offset projections are no longer a nice-to-have — they are a core component of project financing. Investors, offtakers, and regulators all want quantified environmental impact. This tool calculates avoided emissions using EPA eGRID factors specific to your state's grid mix.
"Calculate the carbon offset for a solar project generating 186,108 MWh/year in California"
Quantifiable carbon impact strengthens project financing and ESG reporting. These numbers map directly to voluntary carbon credit markets, corporate PPA negotiations, and IRA Section 45Y clean electricity production credit applications.
Generate Visual Report
The final step produces satellite imagery with environmental constraint overlays — the kind of maps you would include in an investment committee memo or a landowner presentation. These are professional-grade constraint maps comparable to what firms charge thousands of dollars to produce.
"Generate satellite imagery with environmental overlays for 34.6868, -118.1542"
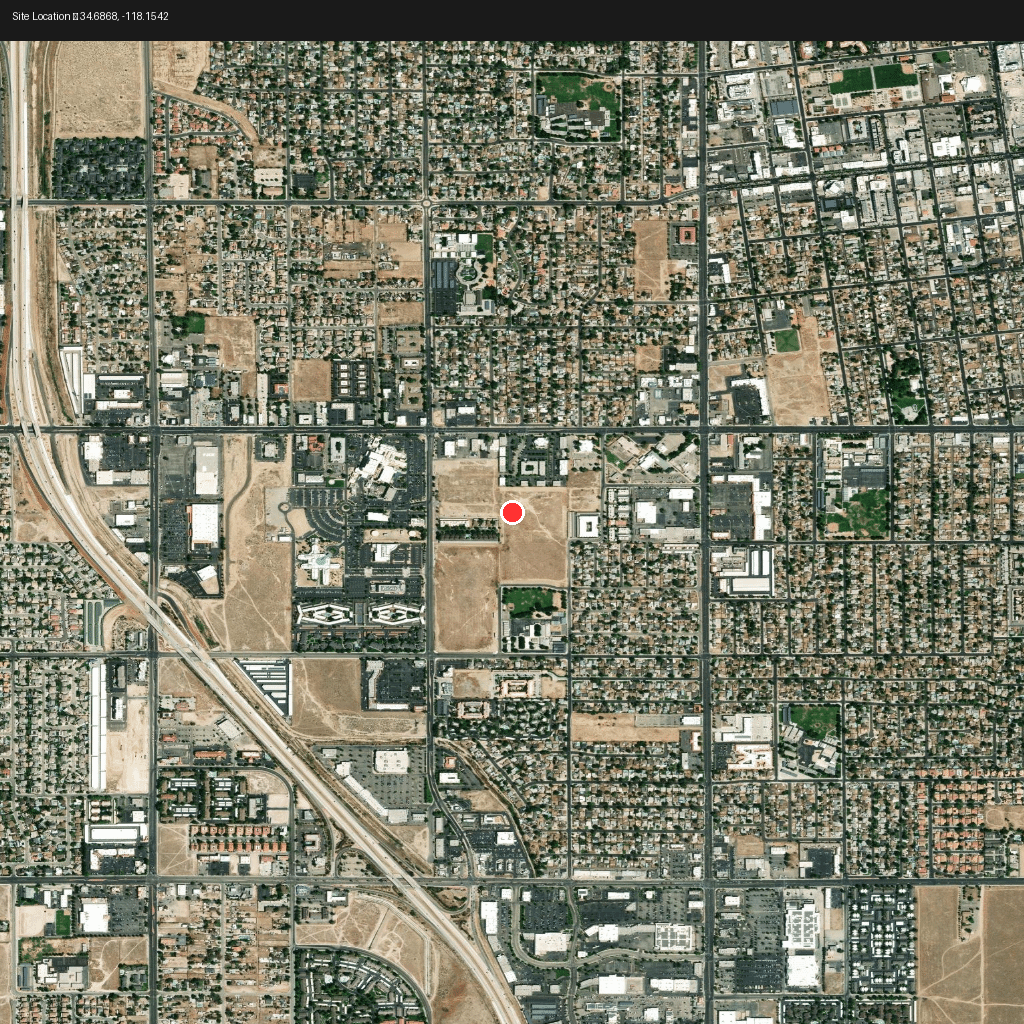
Satellite base imagery
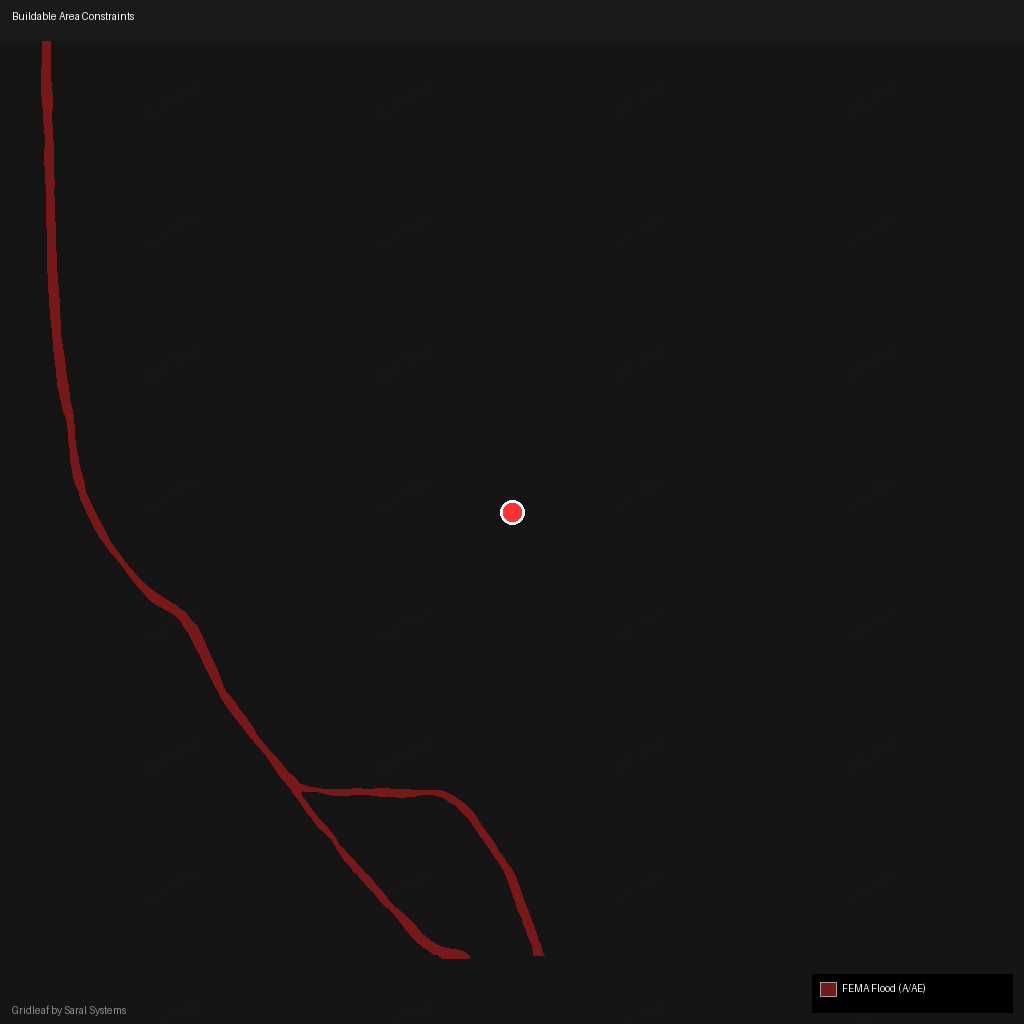
Constraint overlay map
Professional constraint maps comparable to Anderson Optimization reports — generated in seconds, for free. Attach these to your site memo, share with investors, or use them in landowner negotiations to demonstrate due diligence.
Go / No-Go Decision
Strengths
- Strong solar resource (21.2% CF, well above national average)
- Flat terrain (0.8% avg slope) minimizes grading costs
- Clean environmental screen (no wetlands, species, or protected areas)
- Significant carbon offset potential (42,040 t CO₂/yr)
Considerations
- ~47% of parcel excluded by flood zone polygons (reduces buildable area)
- CAISO negative pricing during solar peak hours may affect revenue
- Interconnection queue congestion in CAISO territory
Recommended Next Steps
- Commission a Phase I Environmental Site Assessment for the buildable 53 acres
- Submit an interconnection pre-application to SCE or LADWP
- Run a CAISO market analysis to model revenue under curtailment scenarios
- Engage a title company for land ownership and easement due diligence
- Evaluate battery storage co-location to capture curtailed energy
This entire analysis was completed in under 15 minutes using free Gridleaf tools.